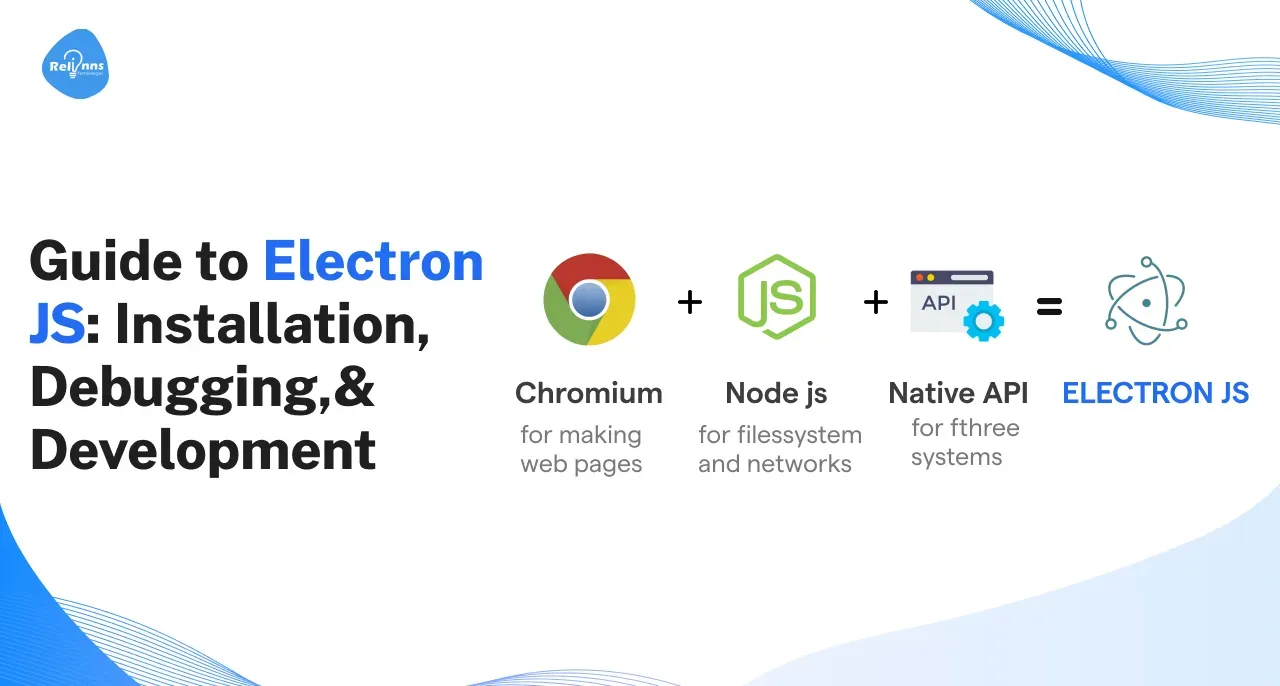
Guide to Electron JS: Installation, Debugging,& Development
Date
May 16, 24
Reading Time
2 minutes
Category
Technology
- Prerequisites
- Installing Electron JS
- How to Debugging Electron JS app
Table of content

Electron JS is the open-source framework that allows us to build a desktop app for multiple platforms ( Mac, Windows, and Linux ). Electron is the combination of the Chromium rendering engine and Node runtime environment. Due to this, we can use web technologies to build our desktop app.
Prerequisites
Before installing Electron JS, make sure to have the below-mentioned Softwares.
- Node Js.
- NPM ( Node Pack Manager )
To check if this software exists in your machine, Open up your command line or console and type: $ node -v $ npm -v If your machine misses this software, you can download it from the official node.js website for your OS.
Installing Electron JS

While installing electron js, we have two options to install,
- Install electron js as Global dependency.
- Install electron js as Dev dependency.
For installing electron js as Global dependency run command, $ npm install electron -g For installing electron js as Dev dependency run command, <br $ npm install electron --save-dev --save-exact
How to Debugging Electron JS app
 We have two processes that run our application, The main process, and the renderer process. Since the renderer process runs only in the browser we can debug it through our browser dev tool by using the shortcut "Ctrl+Shift+I" or the <F12> key. The dev tool in our browser can only debug the javascript that runs in our browser. To debug the code which runs in the main process you will need to use an external debugger by running the command --debug while launching the electron app. $ electron --debug = 4425 ./main.js Note: we need to use a debugger that supports the V8 debugger protocol. We can use the VS Code for this purpose by adding the configuration. Create a file in your project directory in a path ".vscode/launch.json" with the following configuration − { "version": "1.0.0", "configurations": [ { "name": "Debug Electron JS Main Process", "type": "node", "request": "launch", "cwd": "${workspaceRoot}", "runtimeExecutable": "${workspaceRoot}/node_modules/.bin/electron", // For Linux and Mac "${workspaceRoot}/node_modules/.bin/electron.cmd" // For Windows "program": "${workspaceRoot}/main.js" } ] } Now set some breakpoints and start debugging in the debug view. we can also use node-interceptor for debugging purposes.


